Real Time Twitter sentiment analysis with Azure Cognitive Services
I was recently playing with Azure Cognitive Services and wanted to test Sentiment Analysis of Twitter. In this blog post I will go through how to setup the different components and analyse the sentiment of Tweets that contain the Azure or AWS hashtag. We will then be able to compare the sentiment of Azure tweets versus AWS tweets and analyse if Azure is in a better spotlight than AWS, which country prefers AWS over Azure, get the most influential people, and many more things that would be hugely beneficial for any social media marketing team.
For this solution to work we will need the following Azure Services:
- Azure Logic Apps to collect and read Tweets with a certain hashtag
- Azure Cognitive Services to analyse the sentiment in the tweet
- Azure SQL DB to store the tweet and the sentiment
- Power Bi to to visualise the sentiment
Granted, I could have skipped the database step and stream from logic apps directly into Power BI but that will be for another blogpost.
Azure SQL DB
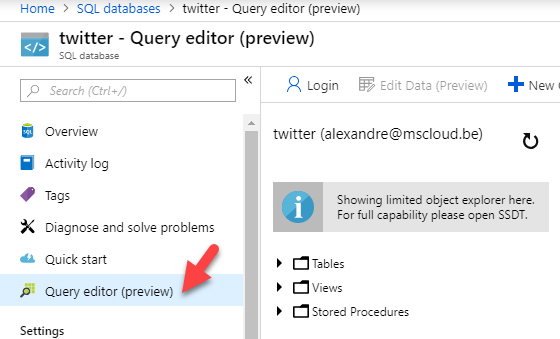
First create a new Azure SQL DB and open the query editor to create the table:
Run the following SQL query to create the table for Azure
CREATE TABLE AzureTweets (

id int PRIMARY KEY IDENTITY,

createdDate datetime DEFAULT(getdate()),

tweettext varchar(512) SPARSE NULL,

sentiment Float NULL,

author VARCHAR (512) ,

location VARCHAR (512) ,

);
I then run the same command to have a table for AWS tweets.
CREATE TABLE AWSTweets (

id int PRIMARY KEY IDENTITY,

createdDate datetime DEFAULT(getdate()),

tweettext varchar(512) SPARSE NULL,

sentiment Float NULL,

author VARCHAR (512) ,

location VARCHAR (512) ,

);
Cognitive Services key
We will need Azure Cognitive services to analyse our Tweet and detect the sentiment of the tweet. The Text Analytics API, which is part of the Cognitive services, is a cloud-based service that provides advanced natural language processing over raw text has 3 main components: sentiment analysis, key phrase extraction, and language detection. There is a 4th component which is in preview now called Entity recognition which identifies and categorize entities in your text as people, places, organizations, date/time, quantities, percentages, currencies, and more. Well-known entities are also recognized and linked to more information on the web.
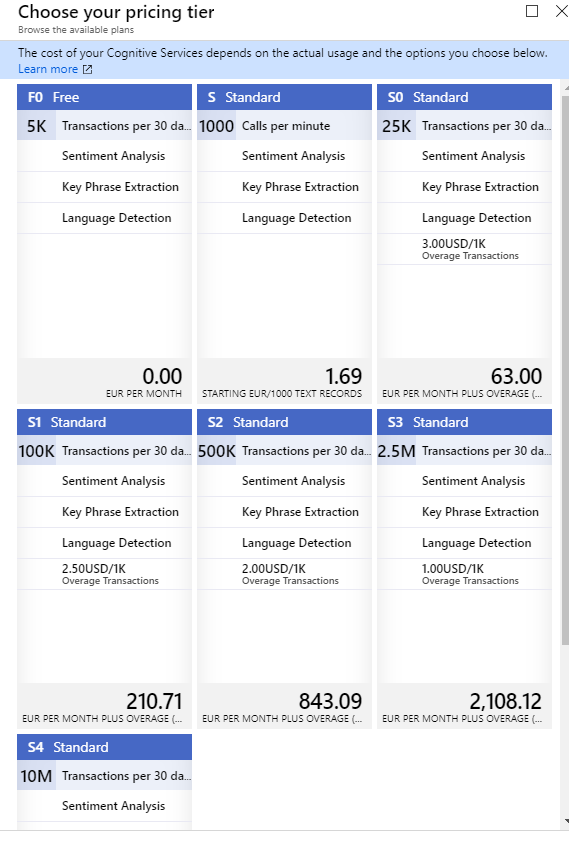
For this blog post we will focus on the Sentiment analysis which uses a machine learning classification algorithm to generate a sentiment score between 0 and 1. Scores closer to 1 indicate positive sentiment, while scores closer to 0 indicate negative sentiment. The model is pretrained with an extensive body of text with sentiment associations. Currently, it is not possible to provide your own training data. Currently, Sentiment Analysis supports English, German, Spanish, and French. Other languages are in preview. Sentiment analysis produces a higher quality result when you give it smaller chunks of text to work on. This is opposite from key phrase extraction, which performs better on larger blocks of text. ou must have JSON documents in this format: id, text, language and document size must be under 5,000 characters per document, which is not an issue for our Tweets. From a pricing point of view its literally a few cents per 1000 API requests.
We will need an API key for the logica app to connect to Azure cognitive services. Get the key for the Text Analysis API here: https://azure.microsoft.com/en-us/try/cognitive-services/my-apis/?api=text-analytics
Azure Logic App
Create a new blank Azure Logic app. Edit the workflow of the logic app in the logic app designer. Click the “new step” button and add three actions.
- First we need to collect the Azure related tweets
- then we need to analyze the sentiment
- and lastly we will store the tweet with the sentiment in our SQL database
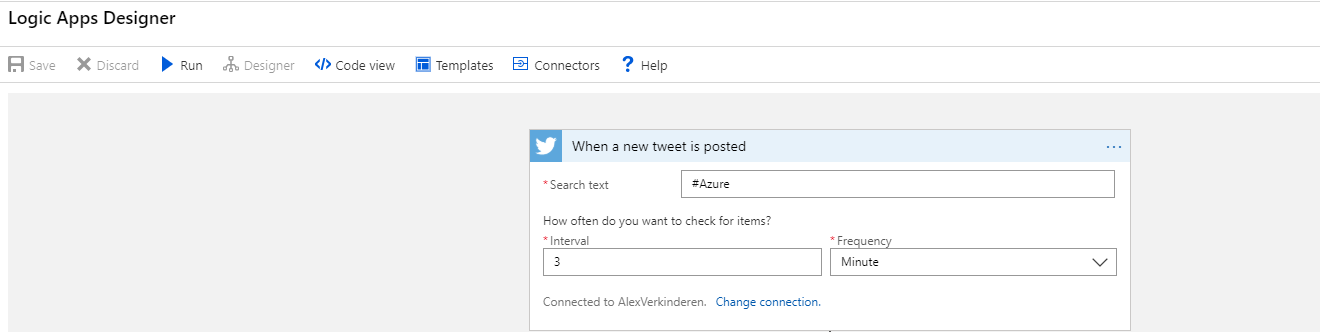
If you click the Twitter step, it will ask you to configure a connection to Twitter. Specify your credentials. Then enter the appropriate values regarding keywords and interval. I set the interval to 3 Minutes and specify the #Azure hashtag. If you want near real time analysis you should lower this value but the more actions are executed the more you will pay.
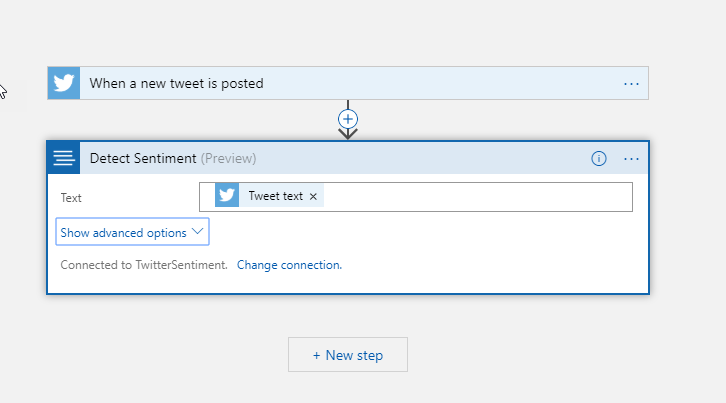
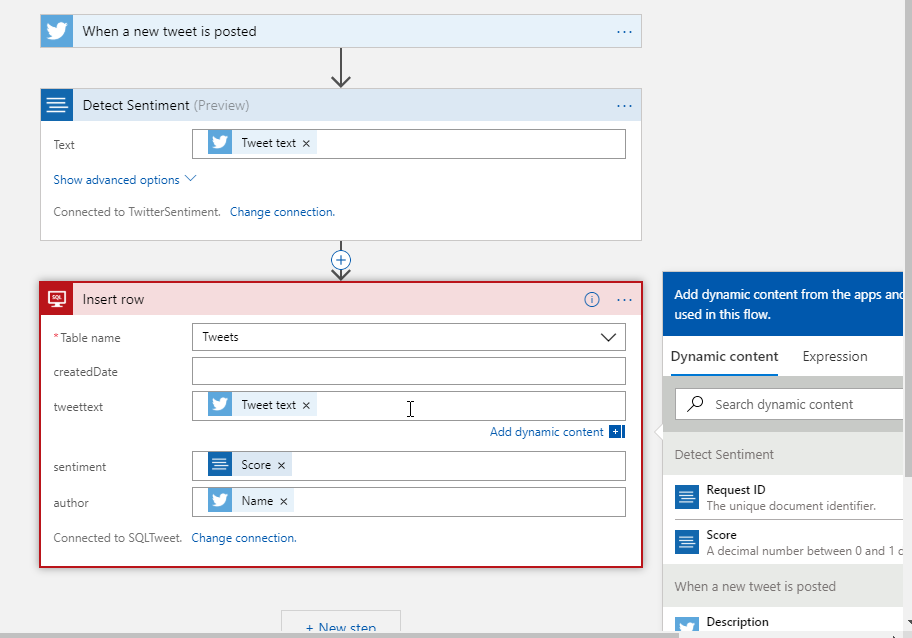
Next add the sentiment action to the workflow. First you have to specify the keys you created earlier and give the new connection a name. Then you need to specify the “Tweet Text” from Dynamic content
As a result of this we will now have a sentiment, or a value ranging from 0 to 1, that we can insert in our database. Add a new action to insert a row in the database. Establish a connection to a specific database first. Then specify the table (AzureTweets, in my case) and pass the values , again taken from the dynamic content like the Tweet Text, the author, location and sentiment.
Click Save and Run.
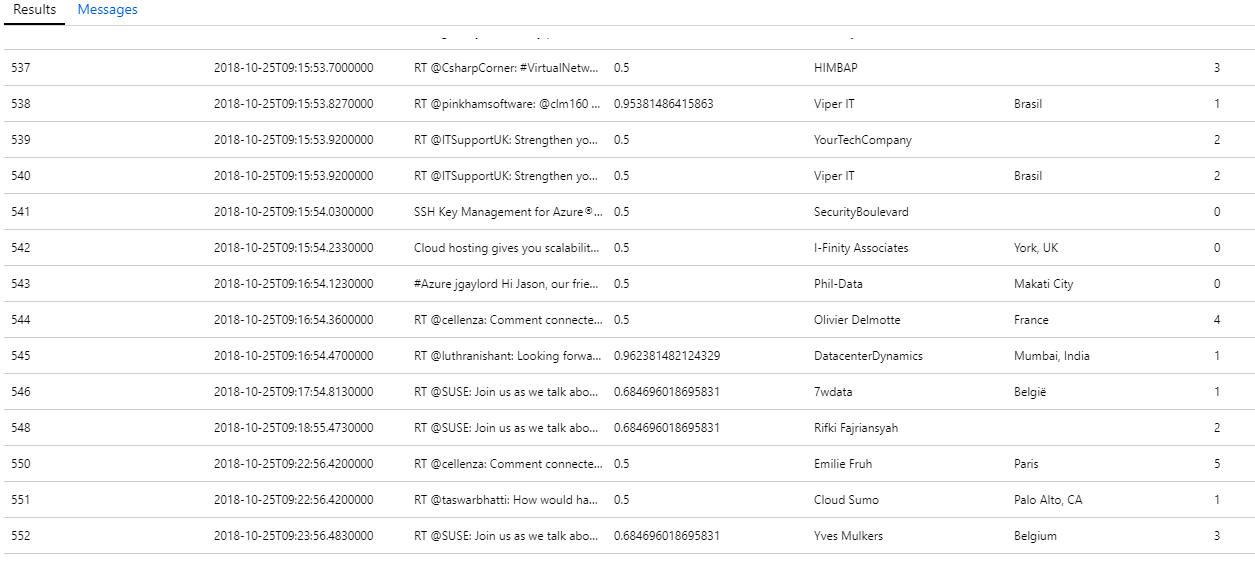
After a while you should see some tweets coming into our database:
Do the same steps mentioned above for AWS.
Power Bi
Now that we have our tweets and sentiment in our SQL Database we can create a nice looking dashboard to visualize the sentiment.
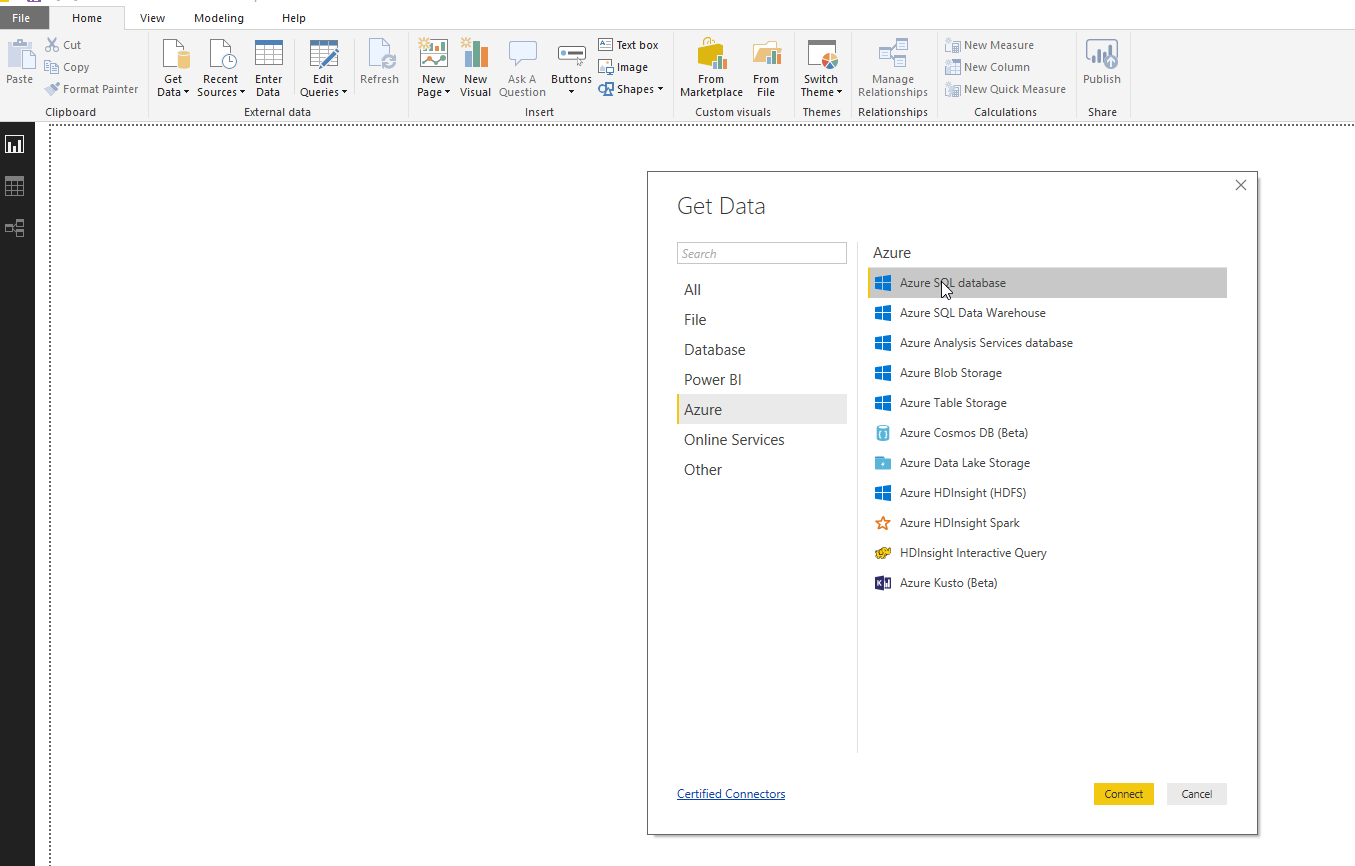
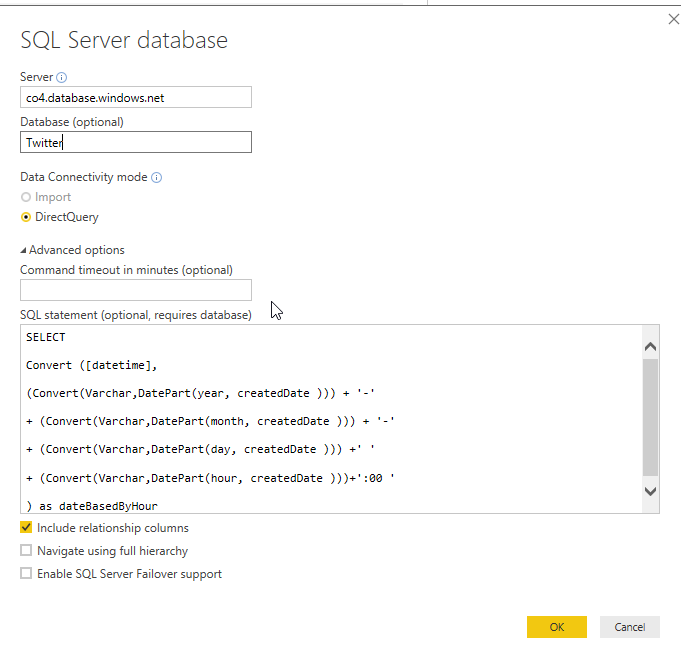
In Power BI click “Get Data” and pick “Azure SQL Database”.
Specify servername and database name and choose “Direct Query”. This way the data shown by the report is taken directly from the database
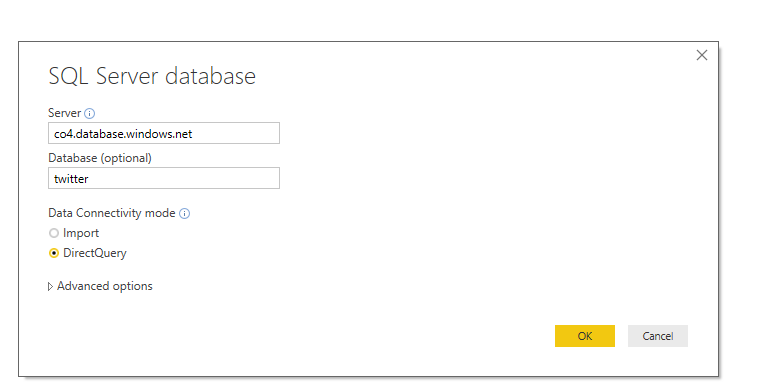
Press “advanced options” to be able to run a T-SQL query on the data to adjust it before using it in your report.
Now that we have the data in Power Bi we can start building our dashboard.
If you don’t already have the Word Cloud custom visual installed, install it. In the Visualizations panel to the right of the workspace, click the three dots (…) and choose Import From Store. Then search for “cloud” and click the Add button next the Word Cloud visual. Power BI installs the Word Cloud visual and lets you know that it installed successfully.
First, click the Word Cloud icon in the Visualizations panel. A new report appears in the workspace. Drag the Tweet field from the Fields panel to the Category field in the Visualizations panel. The word cloud appears inside the report. Now switch to the Format page of the Visualizations panel. In the Stop Words category, turn on Default Stop Words to eliminate short, common words like “of” from the cloud.
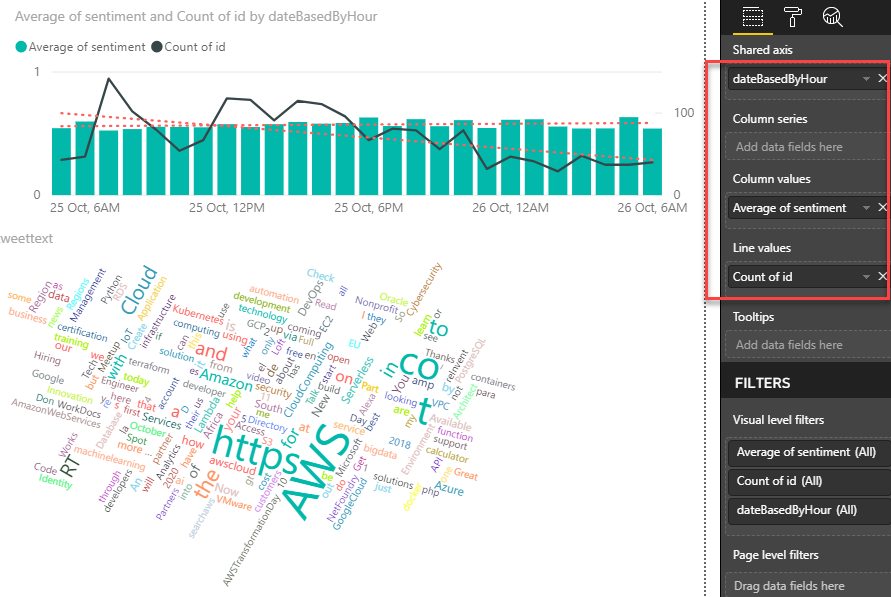
Now create a “Line and clustered column chart” as seen below. Activate the values “datebasedbyhour” and “id” and “sentiment” as shown below. Make sure you’re using “Average of sentiment” (not sum) as column value and Count of id (not sum) as a line value.
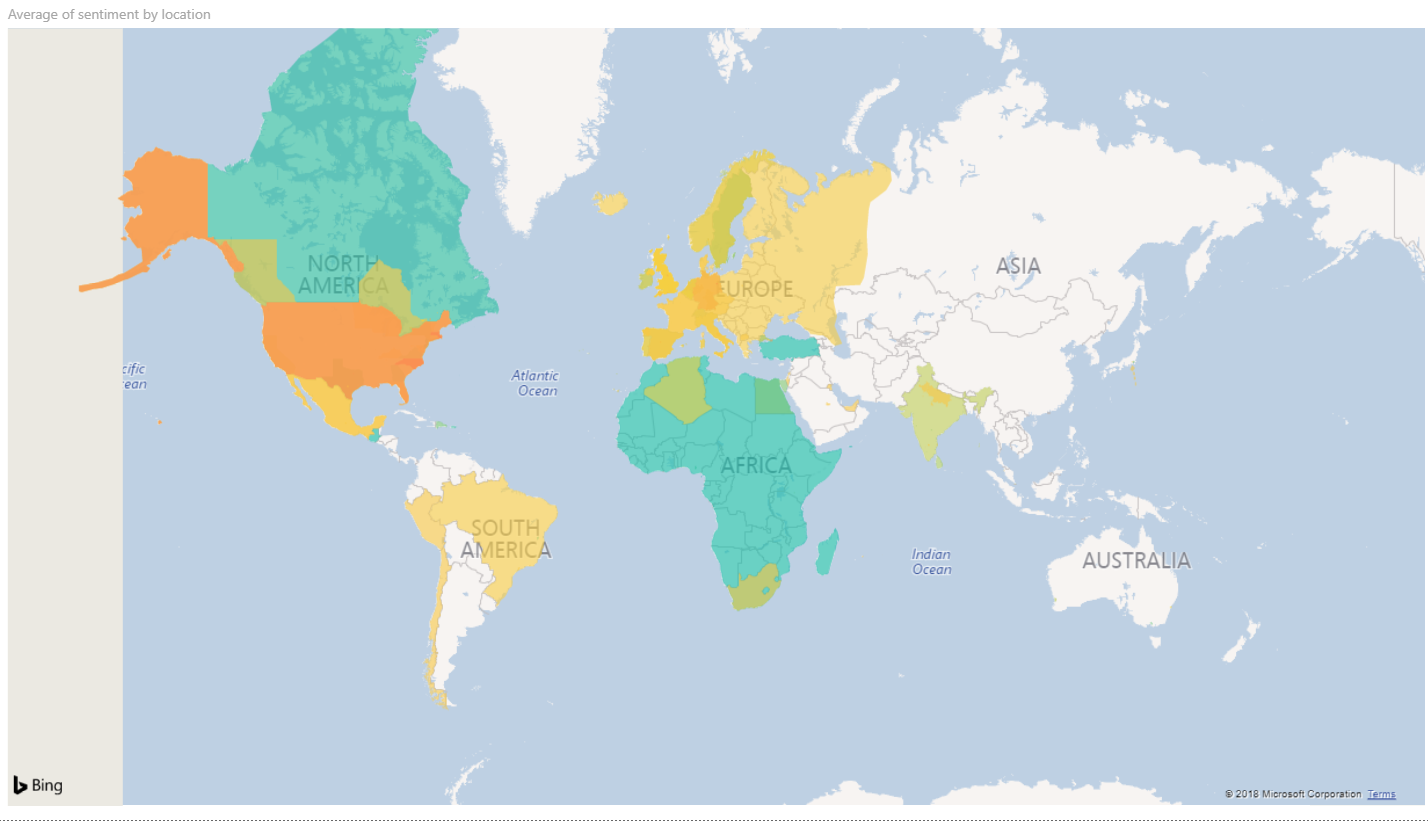
Next add the “Filled Map” and select Location as Location and for Color of saturation add “average of sentiment”. We can clearly see that people in North America and Africa are more positif feeling than people in the US for example.
My final result looks like this:

That’s it folks! You can download my Power BI report file from here.
Thanks,
Alex
Leave a comment